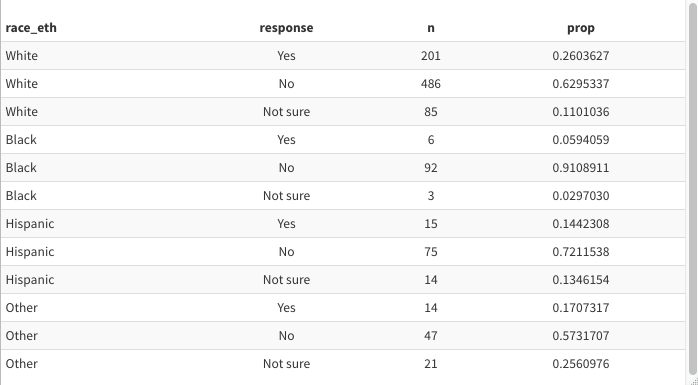
You may find this data set in the `usdata` R package (automatically loaded with the `openintro` R package) or on this page.
This week's data set is race_justice. In the days following George Floyd's murder, YouGov conducted a poll for Yahoo! News (details). In total 1060 U.S. adults were asked a series of questions regarding race and justice. This data set contains responses to the question "Do you think Blacks and Whites receive equal treatment from the police?" along with the race of the respondent. (Note: this question only received 1059 responses).

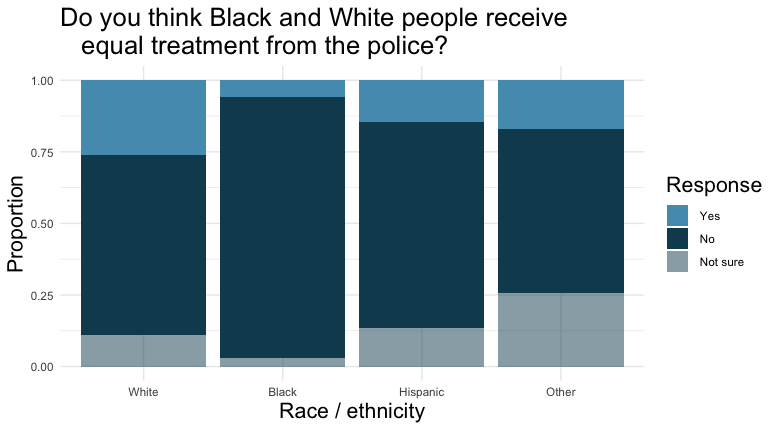
This data set can be used for a few different topics in inferential statistics; more specifically a chi-square test for independence and a two-sample proportion test. A stacked bar plot can provide motivation for the test for independence, from which it is apparent that the proportions are different across all races.

I think that data sets like this one allows students to apply what they are learning to current events and learn what different members of their community believe or feel.
