The data set is mariokart. This data set is available on openintro.org/data and in the `openintro` R package.
This week we'll be exploring the `mariokart` data set! Mario Kart is a popular go-kart racing game on Nintendo consoles. First released on the Super Nintendo in 1992, the game allows players to race against friends or the computer as their favorite character from the Super Mario franchise. A newer release, Mario Kart 8, gives players the ability to race as Link from the Legend of Zelda franchise via downloadable content.
The data set `mariokart` in the openintro package contains information about Ebay auctions that included Mario Kart for the Nintendo Wii gaming console. The data set contains a variety of numeric and categorical variables which allow many types of analysis. In my introductory statistics courses, we use this data set for a more in depth discussion of least squares regression and outliers. In particular, how do we visually identify possible outliers and then go back to the raw data to see why the point(s) in question stand out. Is it really an outlier -. a data point that is not truly a part of the population we are studying - that we can remove to improve the fit of our regression model or is it really a part of the population of interest that should remain a part of the model, even if it weakens the fit? Below is the outline for the lesson. For reference, this is taught towards the end of the semester and more often than not is crammed into a single class session.
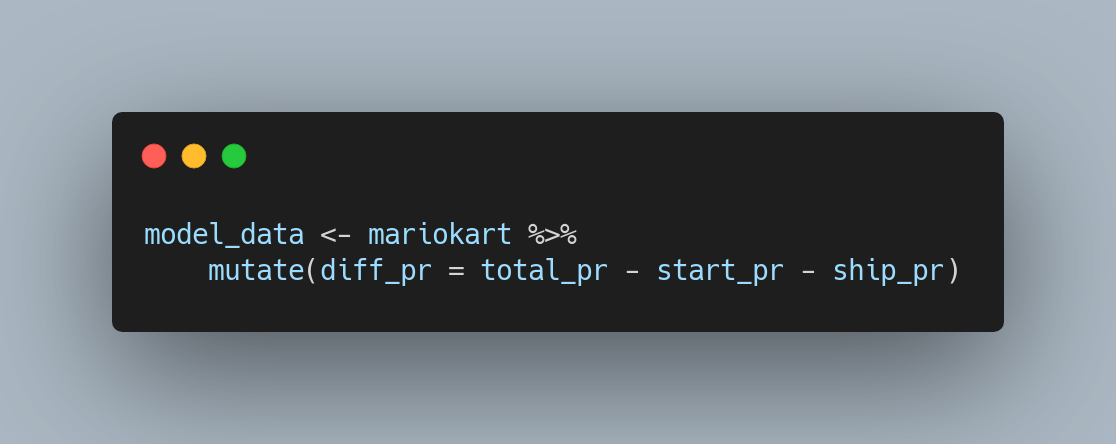
The model I look at with students attempts to predict the price increase over the duration of the auction from the number of bids an auction receives. Specifically, our population of interest is auctions for Mario Kart Wii; we aren't interested in auctions that include bundles of multiple games or the console. The variable does not exist in the data set so it's one we calculate in-class during a live coding session. Typically its something like:

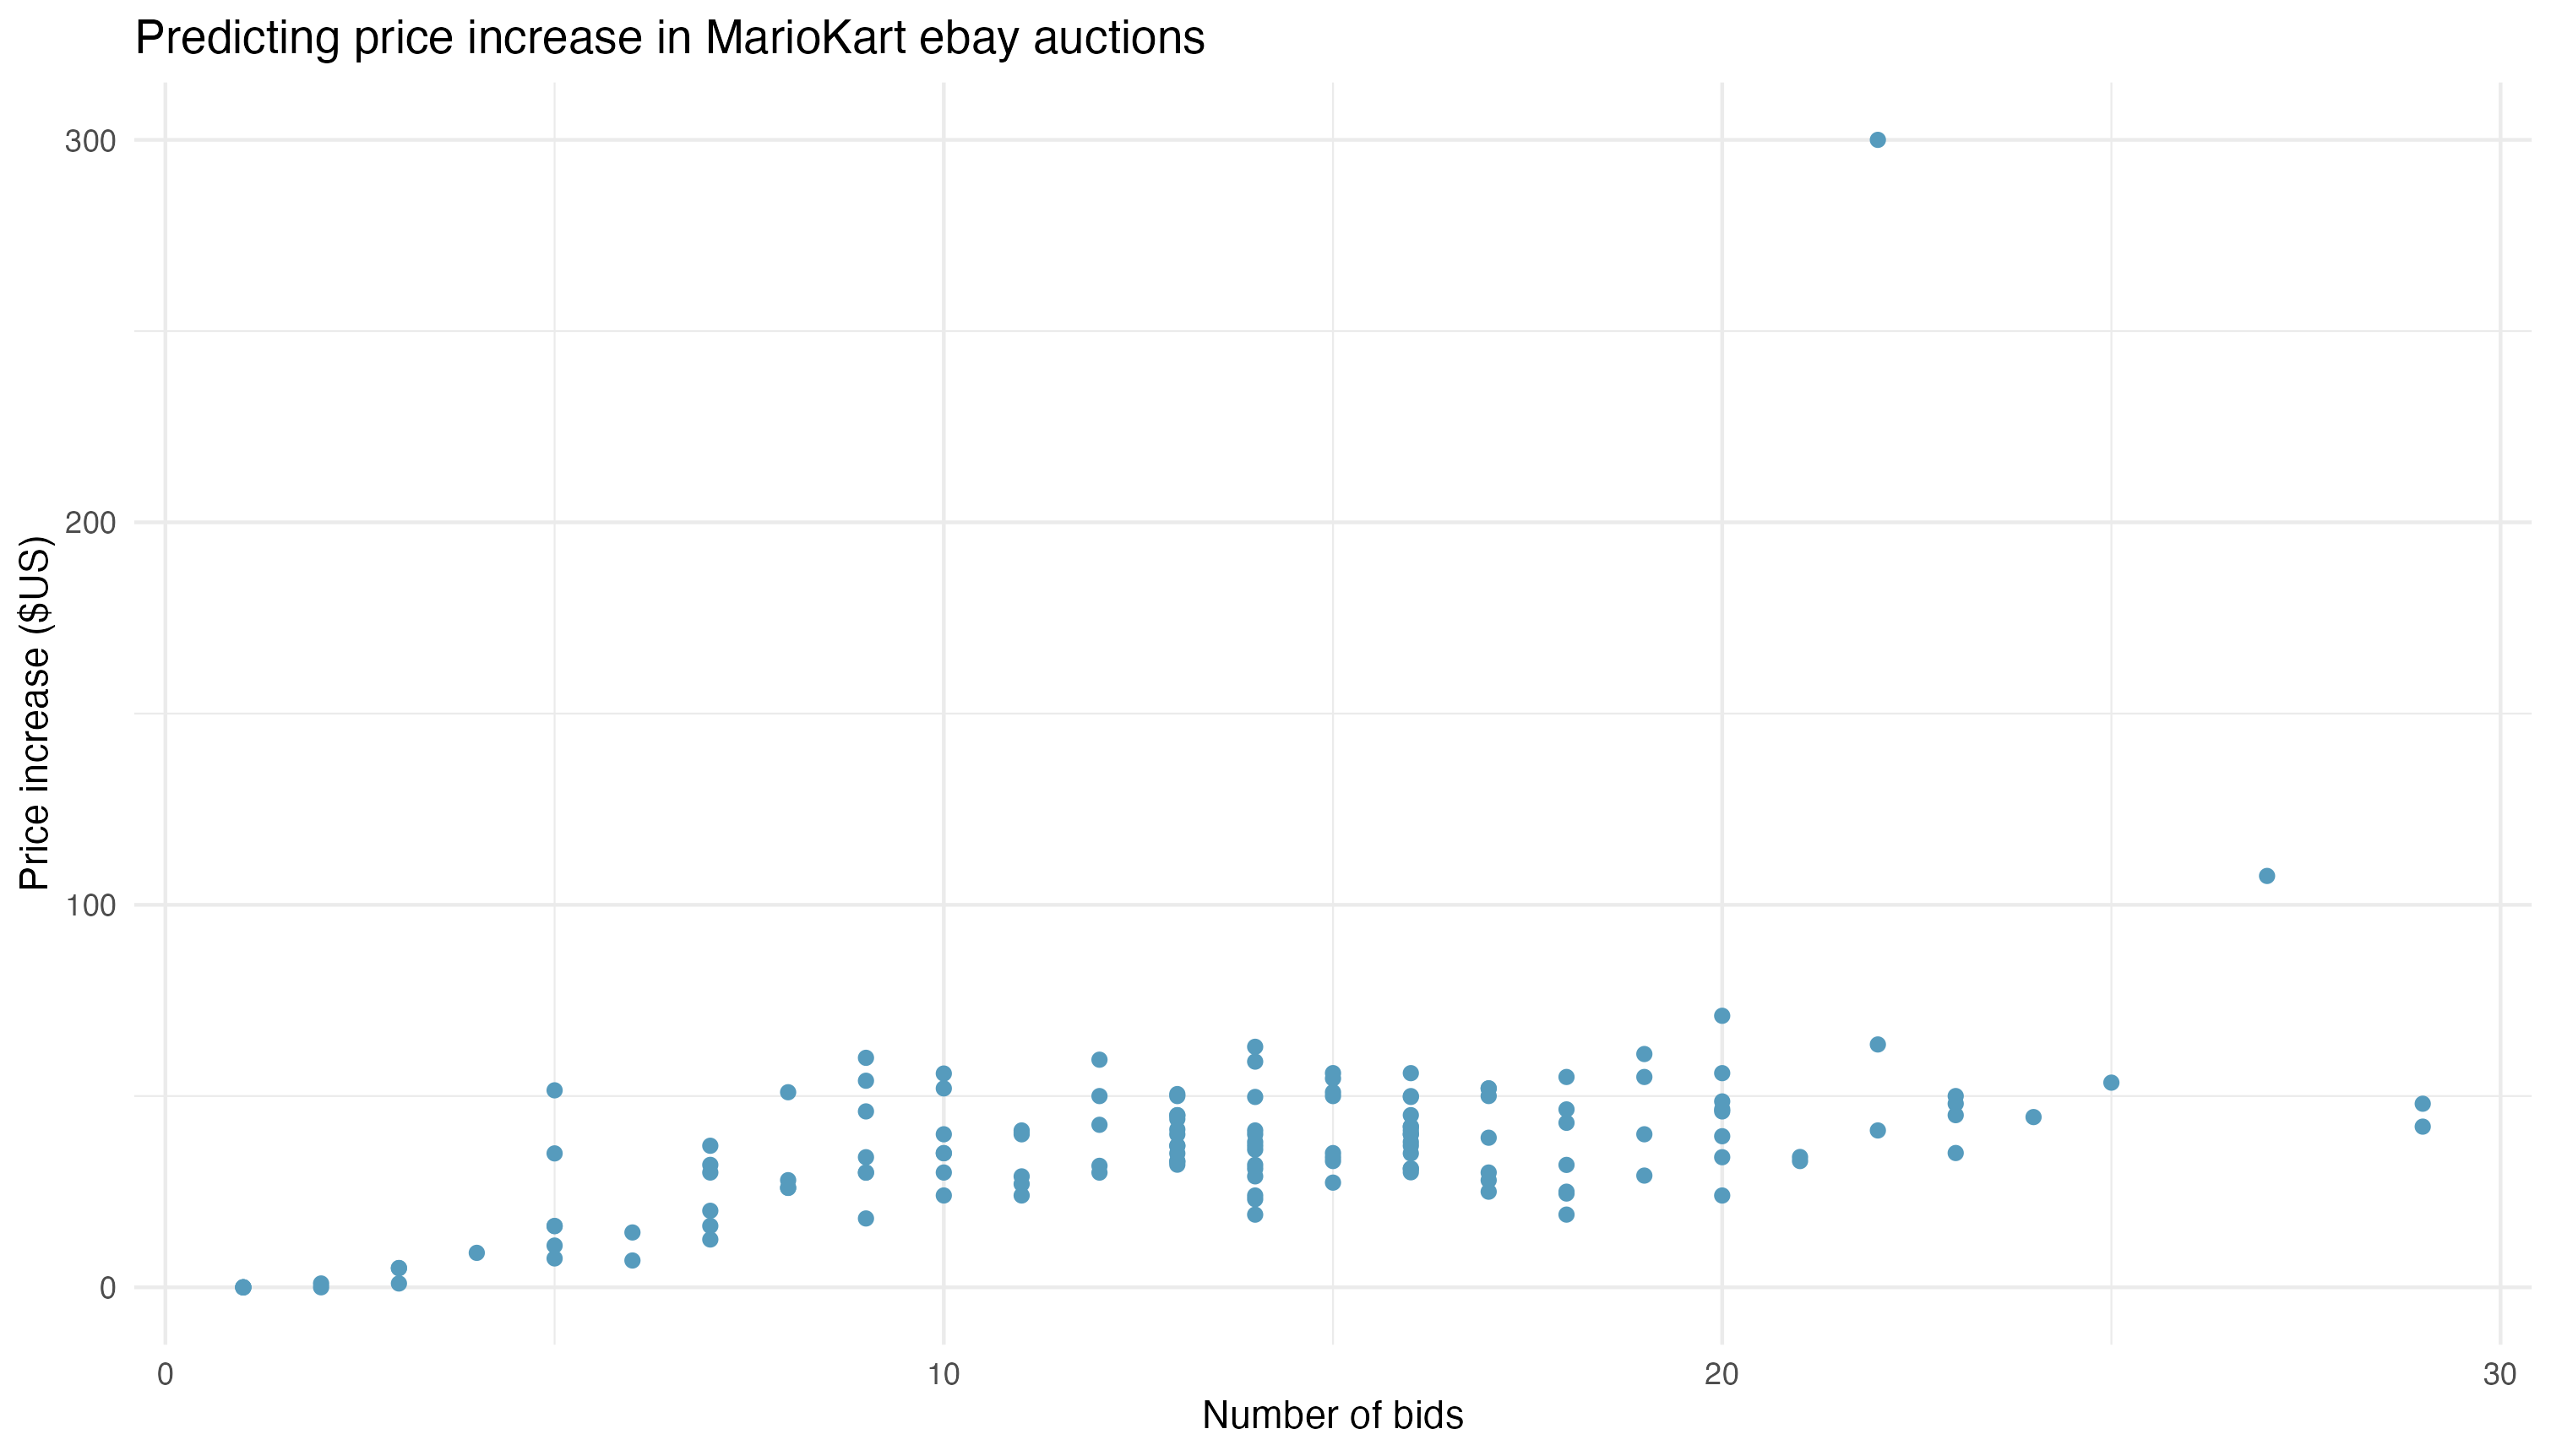
This is the total price minus the start price, minus the shipping price. Aside from the point in question, visible in the scatter plot below, checking a residuals plot shows relatively constant variability and a histogram of the residuals is nearly normal. Here is the plot as students first see it.

Before jumping down this rabbit hole, students work with each other to check multiple explanatory variables and look for one that not only has a good correlation value but logically makes sense as a predictor. Most semesters students come up with starting price, number of bids and duration. The number of bids has the strongest positive correlation so I arbitrarily chose that variable for the lesson. The starting price actually has a slightly stronger correlation, -0.48 compared to 0.46. In the plot above, it's clear that there is an outlier with approximately 22 bids and a price increase of over $300. Once we've identified that point, I'll immediately filter out the point and show that this improves the correlation to 0.62. If I've done my job properly in the days leading up to this, a student will ask if we should do that. This is where our discussion about when to remove an outlier takes place. We'll go back to the data and find out why that particular auction had such a big price increase. It turns out, that auction also included the Wii console and Guitar Hero - another popular game for that console. As it includes much more that we are interested in, we're correct to remove it from our model. Again, if I've motivated students properly, one will ask if there are other data points that should be removed. The answer to that is yes. In a “real world” setting (not a single 60 minute class session) we would need to clean the data prior to building the model. We would do some text analysis of the `title` variable - outside the scope of the course - and remove any auction that is not a part of our population of interest.
Data source: OpenIntro staff collected this data set.
