
The data set is earthquakes. This data set is available on openintro.org/data and in the `openintro` R package.
I have always been interested in earthquakes. Growing up in the Pacific Northwest, I started preparing for them to occur as soon as I was old enough to attend public school. We had to bring "earthquake kits" with non-perishable food so that if there was a quake and our parents couldn't get to us, we would still be able to eat. We had earthquake drills at least once each academic year so we would know what to do to protect ourselves if one occurred during school hours - which it did. By the time I was 14 I had been in two substantial quakes: a 5.0 during my 8th birthday party and a 6.8 while I was at lunch in 9th grade. In time I, like many others, wondered if we might be able to predict earthquakes. When would they occur? How big would it be?
The `earthquakes` data set is a subset of notable earthquakes from the 1900's. This data set has a robust set of variables that make it a great tool for many topics in an introductory statistics class. First, it can be used to discuss the shape of a distribution. For example, the distribution of strength - measured on the Richter scale - follows a relatively normal distribution.

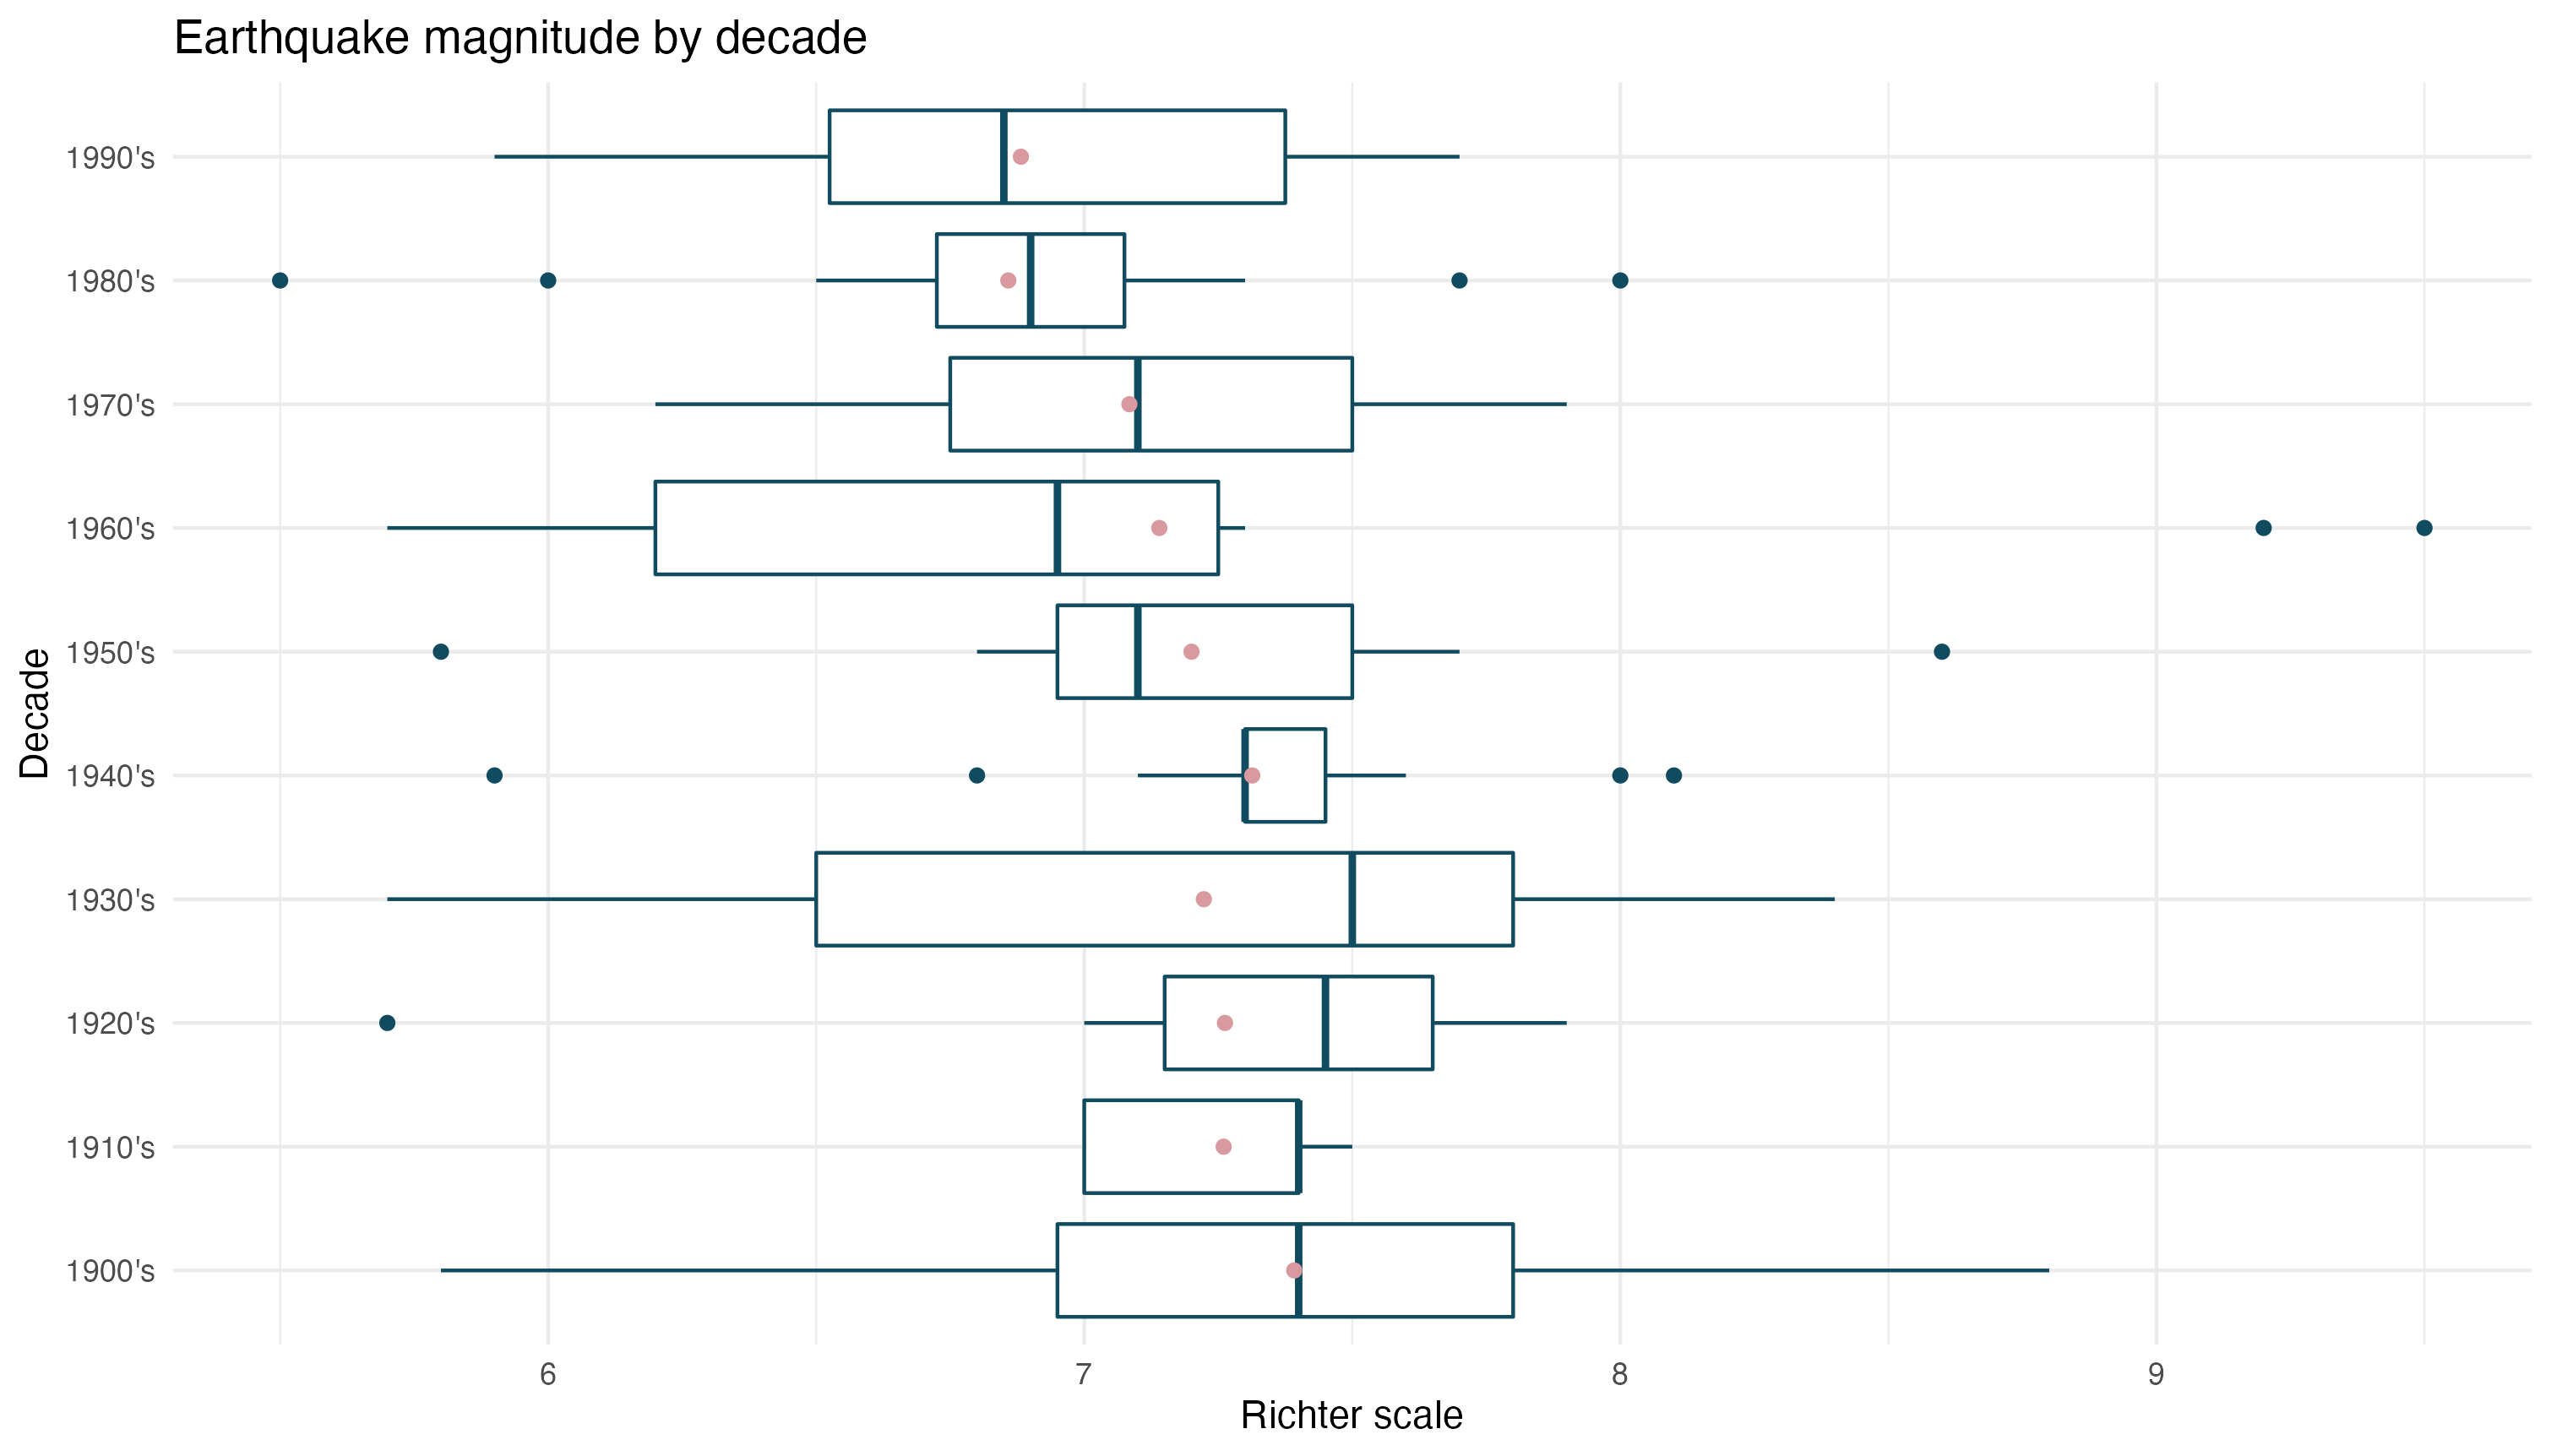
It can also be used for anova tests. The boxplots below suggest that the average intensity of earthquakes decreased in the last decades of the century.
A more advanced application could be to answer the question about earthquakes: can we predict them? A course that reaches multilinear regression could use this data set to attempt to predict either the intensity of an earthquake or the number of deaths one could cause. Of course, attempting to truly build such models requires much more data than is presented here and more computational power than most students have access to. Even so, this data set can provide just enough to wet the appetite and get students more interested in statistical modeling.