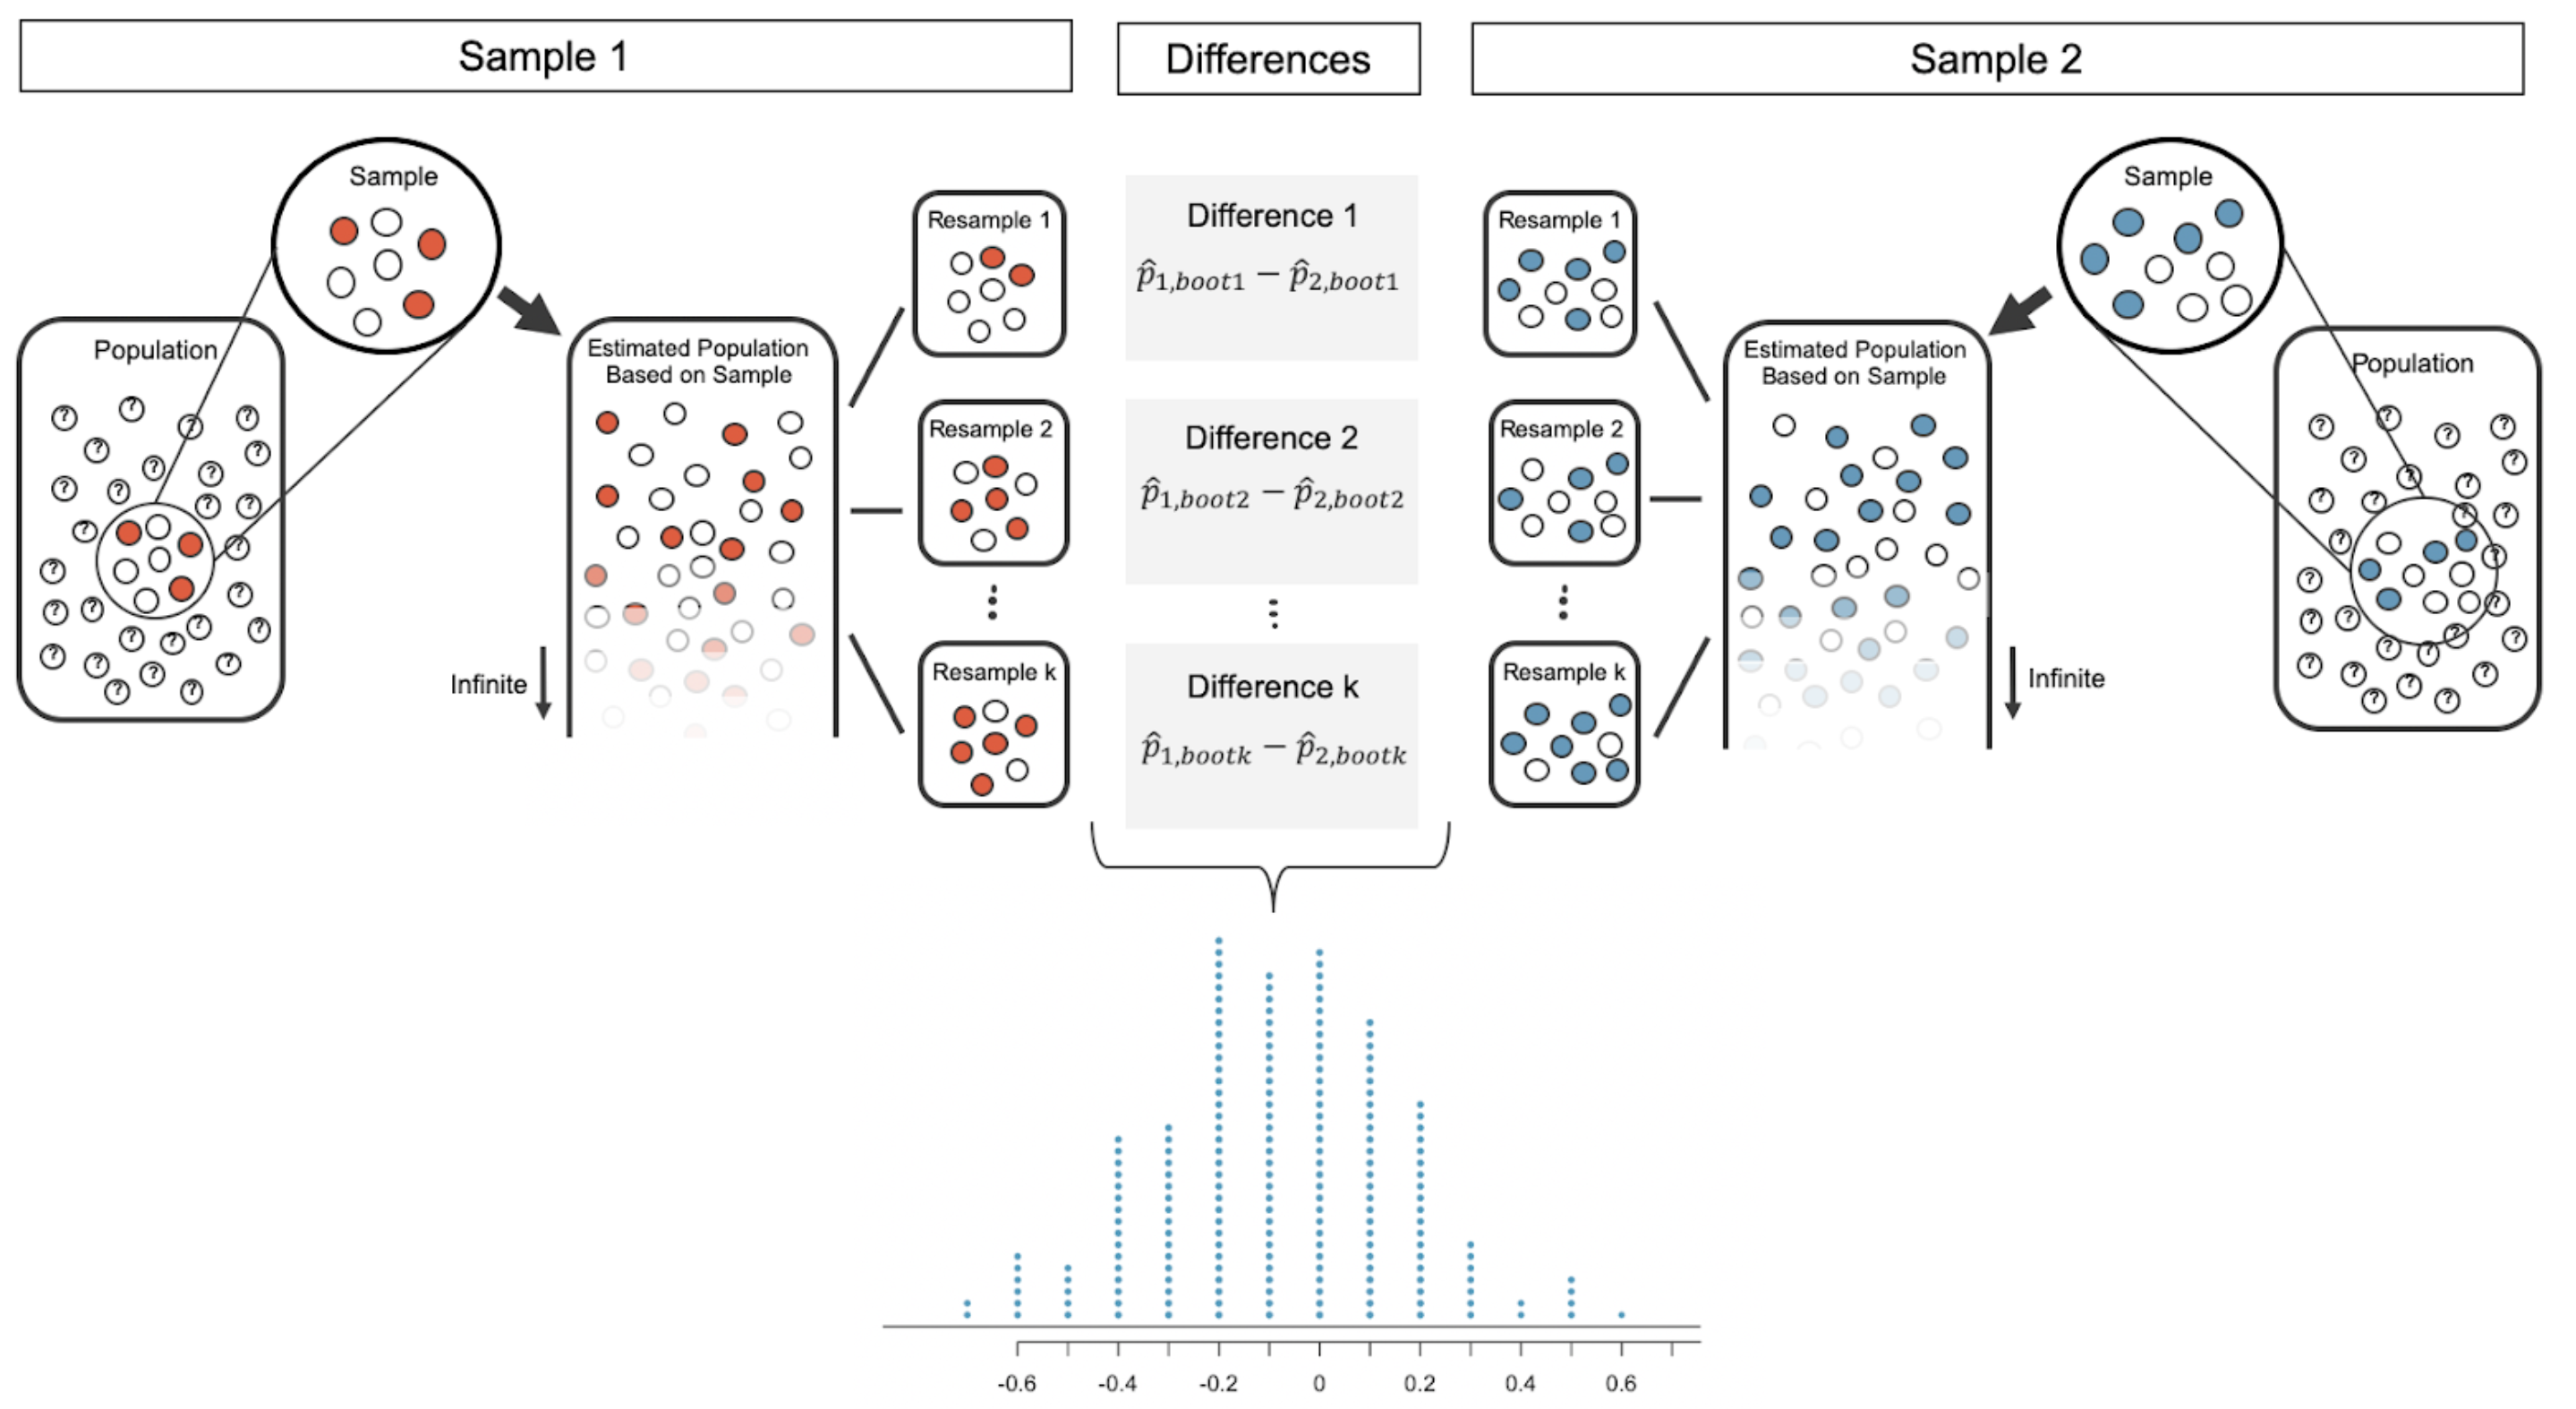
The OpenIntro family of educational products has recently published Introduction to Modern Statistics, which is a re-imagining of a previous title, Introduction to Statistics with Randomization and Simulation. The new book puts a heavy emphasis on exploratory data analysis (specifically exploring multivariate relationships using visualization, summarization, and descriptive models) and provides a thorough discussion of simulation-based inference using randomization and bootstrapping, followed by a presentation of the related Central Limit Theorem based approaches.
Importantly, the online book is freely available in HTML, which offers easy navigation and searchability in the browser. The book is built with the bookdown package and the source code to reproduce the book can be found on GitHub. Along with the bookdown site, this book is also available as a free PDF and as a $20 paperback. Read the book online here.
Among the major changes in the new version, we have introduced every inferential method using a contrast of a computational and mathematical process. Along with methods for hypothesis tests and confidence intervals that are derived from the Central Limit Theorem (t-tests, chi-square test, ANOVA, linear models), we have detailed the corresponding randomization test or bootstrap confidence interval. With model building (multiple linear and logistic regression), we have introduced cross validation as a computational way to assess the performance of a model. The choice to include computational methods in parallel with more traditional mathematical approaches was undertaken for a variety of reasons. Below we provide some of our motivation, and possibly you will be inspired to add computational methods to your own introductory statistics courses.
Intuition
In our experience teaching introductory statistics for many years, sampling distributions rise to the top of concepts that are hard to understand and hard to teach. Many excellent applets exist (e.g., Rossman/Chance Applet Collection and StatKey Applets) for walking students through the logic of statistical inference; we also suggest using tactile in-class activities (e.g., Statistics: A Guide to the Unknown by Peck et al. (2005)) to reinforce the process.
However, without a systematic way of connecting the applets and in-class activities to the specifics of the inferential process, students struggle to connect the mathematical approaches with the computational logic. Introduction to Statistical Investigations (Tintle et al. 2020) and Statistics: Unlocking the Power of Data (Lock et al. 2021) both use simulations extensively, and we value their work and approaches. However, we have presented our material in a novel way with the side-by-side introduction of each method with computational and mathematical procedures. Reinforcing the similarities will ideally lead to deeper understanding of the connections and of the intuition of the logic of hypothesis testing.


Implementation
One might argue for a particular method given either a simpler coding framework or a faster implementation. With many datasets and with most software, calculating test statistics can be almost trivial. And finding a p-value or confidence interval is equally quick. That said, randomization tests on datasets used in most classrooms produce results immediately, with no discernable differences in time to most students. And software programs (e.g., the infer R package, infer.tidymodels.org) make running randomization tests almost as effortless to implement as a t-test.
Mathematical models are cheaper
When running tests on massive datasets, calculation of the summary statistics (for mathematical based inference) can be orders of magnitude faster than permuting or bootstrapping the data. In such cases, it does seem reasonable to claim that the efficiency of the mathematical models would lead the analyst toward the mathematical analysis.
Computational models are cheaper
Sometimes, however, massive datasets can have structures or storage aspects that actually make permutation methods more efficient! Consider a Google dataset where individuals are considered independent, but their searches are not. To use mathematical-based methods, a variety of per-person statistics would be computed. But the data are stored across millions of cores, and each person’s data can be on many different cores. A bootstrap approach, however, can be done on an arbitrary number of cores in a much more computationally efficient manner. The problem, using the Poisson bootstrap, was described in An introduction to the Poisson bootstrap by Amir Najmi on the The Unofficial Google Data Science Blog.
Focus on inference goals
Possibly the best reason for introducing multiple approaches to address the same research question is that the parallel introduction generates questions from your students about which method to use and which method is better. We encourage you to run simulations with your students to compare and contrast the methods, but even without such an activity, we hope that your classroom discussion might draw attention to what qualities make a good test or a good confidence interval. Or how might one even approach a comparison of two different methods. Some ideas for the classroom discussion include:
- What types of data structure (distribution, variability, outliers, sample size) "should" the test be able to assess?
- What would we hope to see if we were focused on "good" Type I error rates? (Note, many students will tell you that they want low type I error rates, but in reality, you should want type I error rates close to alpha.)
- What would we hope to see if we were focused on "good" Type II error rates? Indeed, power is one of the fundamental ideas for students in introductory statistics.
- Which of the considerations above seems most important? Data structure? Type I error? Power?
- What makes a confidence interval method "good"?
What else?
While this blog investigates the side-by-side introduction of the topics from introductory statistics, we'd be remiss if we didn't also tell you about other amazing features of the book!
- Emphasis on multivariable relationships, particularly using data visualization.
- Early introduction to descriptive models and a second look at models for inference and model validation.
- A case study accompanying each part.
- Interactive R tutorials and R labs presented alongside the related content.
- Compelling exploratory data analysis of relevant datasets and with modern visualizations.
- Suitable for use in introductory statistics and data science courses as well as an upper level course that dives deeper into comparisons among computational and mathematical methods presented in the book.

